
The Netdata service monitors performance through Web panels that visualize the processes and services of the Linux system. It monitors CPU, memory, disk, network, process metrics, and many other metrics.
Netdata does not need additional configuration after installation, but the default configuration requires a fit. The performance and speed of the application are not inferior to the built-in console tools, such as vmstat, iostat and htop.
It collects more than 5000 metrics automatically, with zero configuration, it has no dependencies, requires no maintenance and comes with more than 100 alarms pre-configured to detect common failures, performance and availability issues.
Requirements: installed operating system Debian, Ubuntu or CentOS, Fedora.
For Debian/Ubuntu, first of all, we will install curl:
On Debian/Ubuntu and CentOS/Fedora, there is a one-line installation script that will install the latest netdata and also keep it up to date automatically.
The above script will:
- - discover the distribution and installs the needed software packages for building netdata (will ask for confirmation).
- - downloads the latest netdata source tree to /usr/src/netdata.git.
- - installs netdata by executing
./netdata-installer.sh from the source tree.
- - installs
netdata-updater.sh to cron.daily, so your netdata will be updated daily (you will receive a alert from cron only if the update fails).
After installation visit http://your_server_ip:19999/ in your browser now to access the dashboard.
You will see a dashboard and an overview of the system's performance. HUD style indicators at the top of the page change when you hover the mouse over each period of time in the charts.
Diagrams are interactive, you can drag them with the mouse.
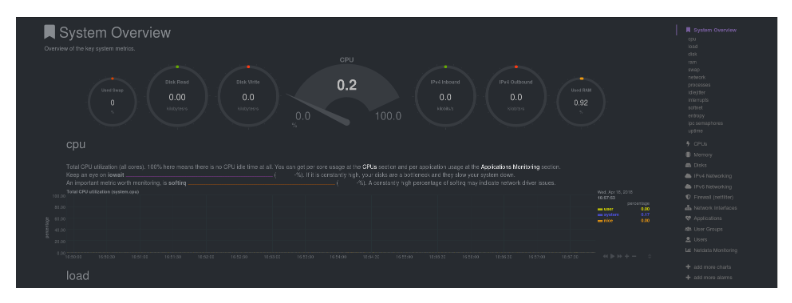
To change the time interval displayed in the chart, hold down Shift and rotate the mouse wheel. To return the graphic to its default view, double click on it.
The individual graphs and diagrams in this section give detailed reports on every aspect of the system, from CPU and memory to network traffic, and so on.
An important part of the GUI is the update page. Netdata is updated regularly, the installation is easy to maintain up to date. At the top of the toolbar is the Update button, which allows you to check if a new version is available for download.
Clicking this button to get more information and open the menu. Use the "Check Now" button to manually check for updates.